In a previous tutorial. you looked at writing your first model using TensorFlow.js. In that tutorial, you used the console to log the loss during the training.
In this short tutorial. you’ll learn how to use the TensorFlow.js Vis library to visualize your training progress in the browser.
The TensorFlow Vis library (or tfjs-vis) is a small library for in browser visualization intended for use with TensorFlow.js.
It’s main features are:
A set of visualizations useful for visualizing model behaviour A set of high level functions for visualizing objects specific to TensorFlow.js A way to organize visualizations (the visor) of model behaviour that won’t interfere with your web application It gives you really great visualization out of the box, and can help new machine learners visualize their model’s training progress.
Installing the TensorFlow.js Vis library
You’ll start with the code from the previous tutorial copied below
<html>
<head>
  <script src="https://cdn.jsdelivr.net/npm/@tensorflow/tfjs@latest"></script>
</head>
<body>
  <script lang="js">
    const model = tf.sequential();
    model.add(tf.layers.dense({ units: 1, inputShape: [1] }));
    model.compile({
      loss:'meanSquaredError',
      optimizer:'sgd'
    });
    model.summary();
    const xs = tf.tensor2d([-1.0, 0.0, 1.0, 2.0, 3.0, 4.0], [6, 1]);
    const ys = tf.tensor2d([-3.0, -1.0, 2.0, 3.0, 5.0, 7.0], [6, 1]);
    model.fit(xs, ys, {
      epochs: 20,
      callbacks:{
        onEpochEnd: async(epoch, logs) =>{
            console.log("Epoch:" + epoch + " Loss:" + logs.loss);
        }
      }
    }).then(() => {
      const test = tf.tensor2d([10], [1,1]);
      const prediction = model.predict(test);
      prediction.print();
    });
  </script>
</body>
</html>
Copy the above code into a new html file, and open it in your browser. You should see a blank page. Open your browser’s development tools. In this tutorial, I’ll be using chrome. You should see something that resembles the screenshot below
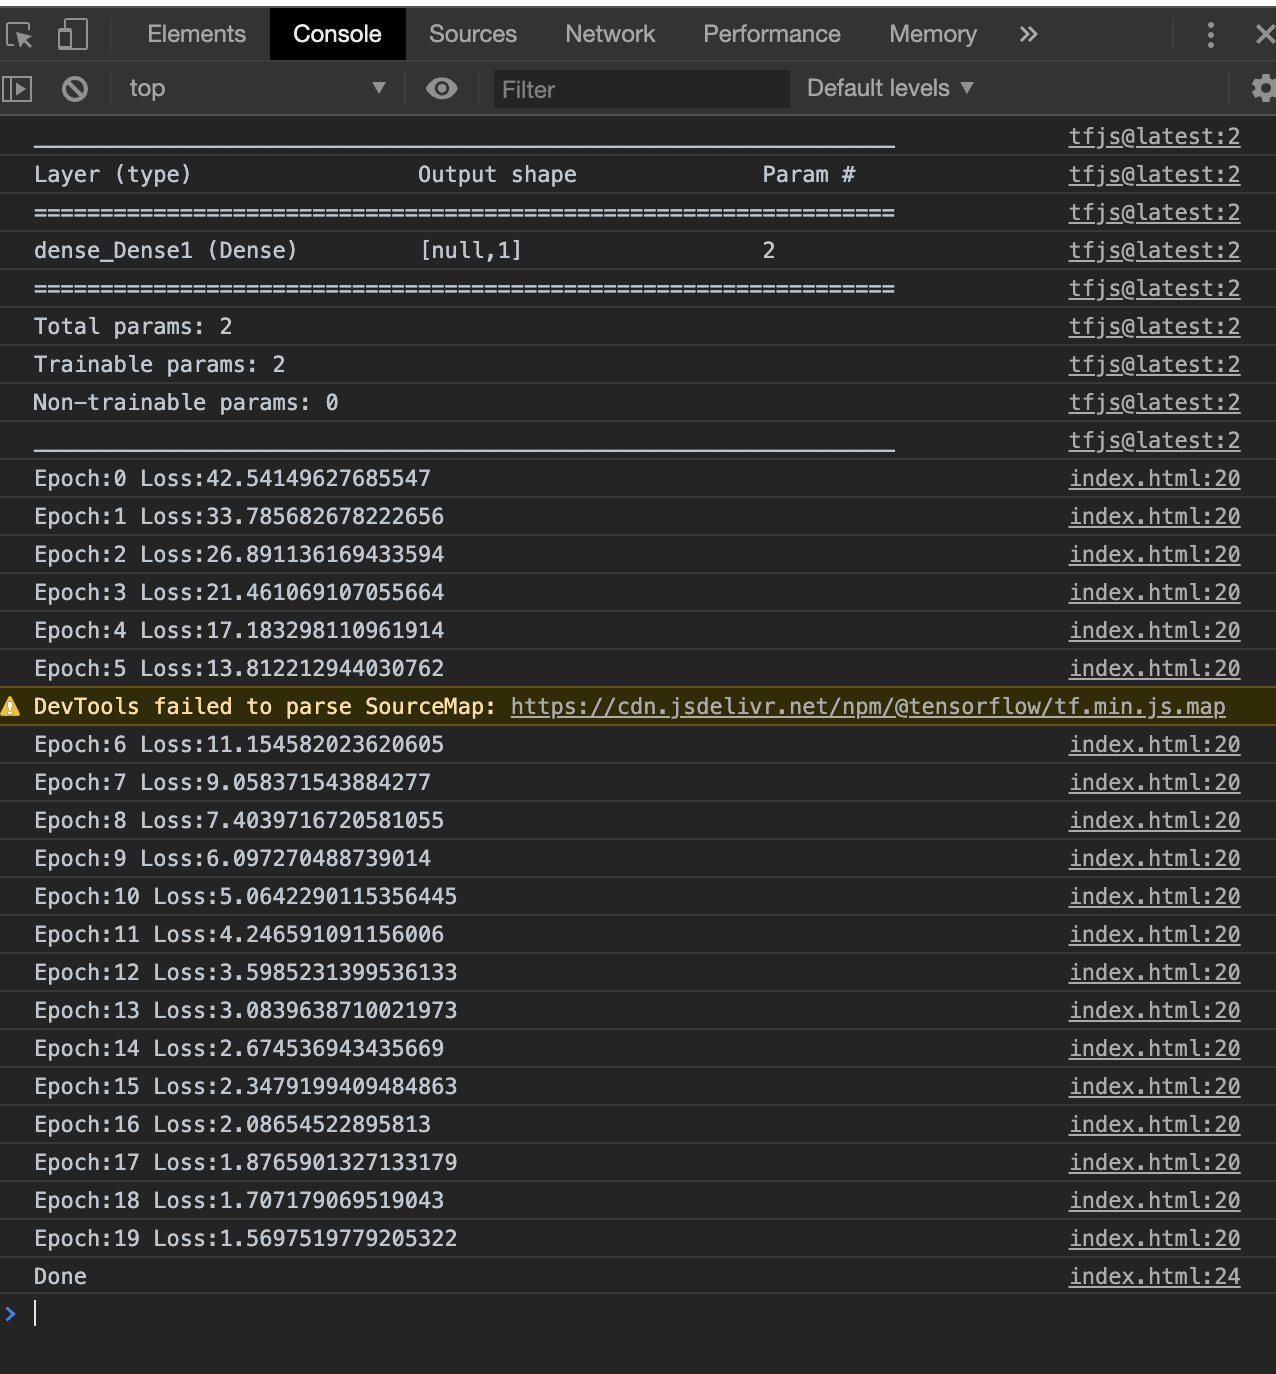
In the screenshot above, you can see that you’re printing the loss directly to console. In order to improve this, you’ll first pull in the tfjs-vis library into the page. Add the following line between the <head> tags, right after the TensorFlow.js library is added. It should look as follows:
<head>
  <script src="https://cdn.jsdelivr.net/npm/@tensorflow/tfjs@latest"></script>
  <script src="https://cdn.jsdelivr.net/npm/@tensorflow/tfjs-vis"></script>
</head>
Awesome. that was the easy part. In the next section, you’ll make use of the library to show the model architecture
Displaying the Model Architecture
In the screenshot above, you can see that you’re printing the model’s architecture in the console. You can do the same using the tfjs-vis library.
Directly below the model.summary() call, add the following line to your code:
tfvis.show.modelSummary({name: 'Model Architecture'}, model);
If you save and refresh your page, you should see a snazzy new side bar. It should as follows:
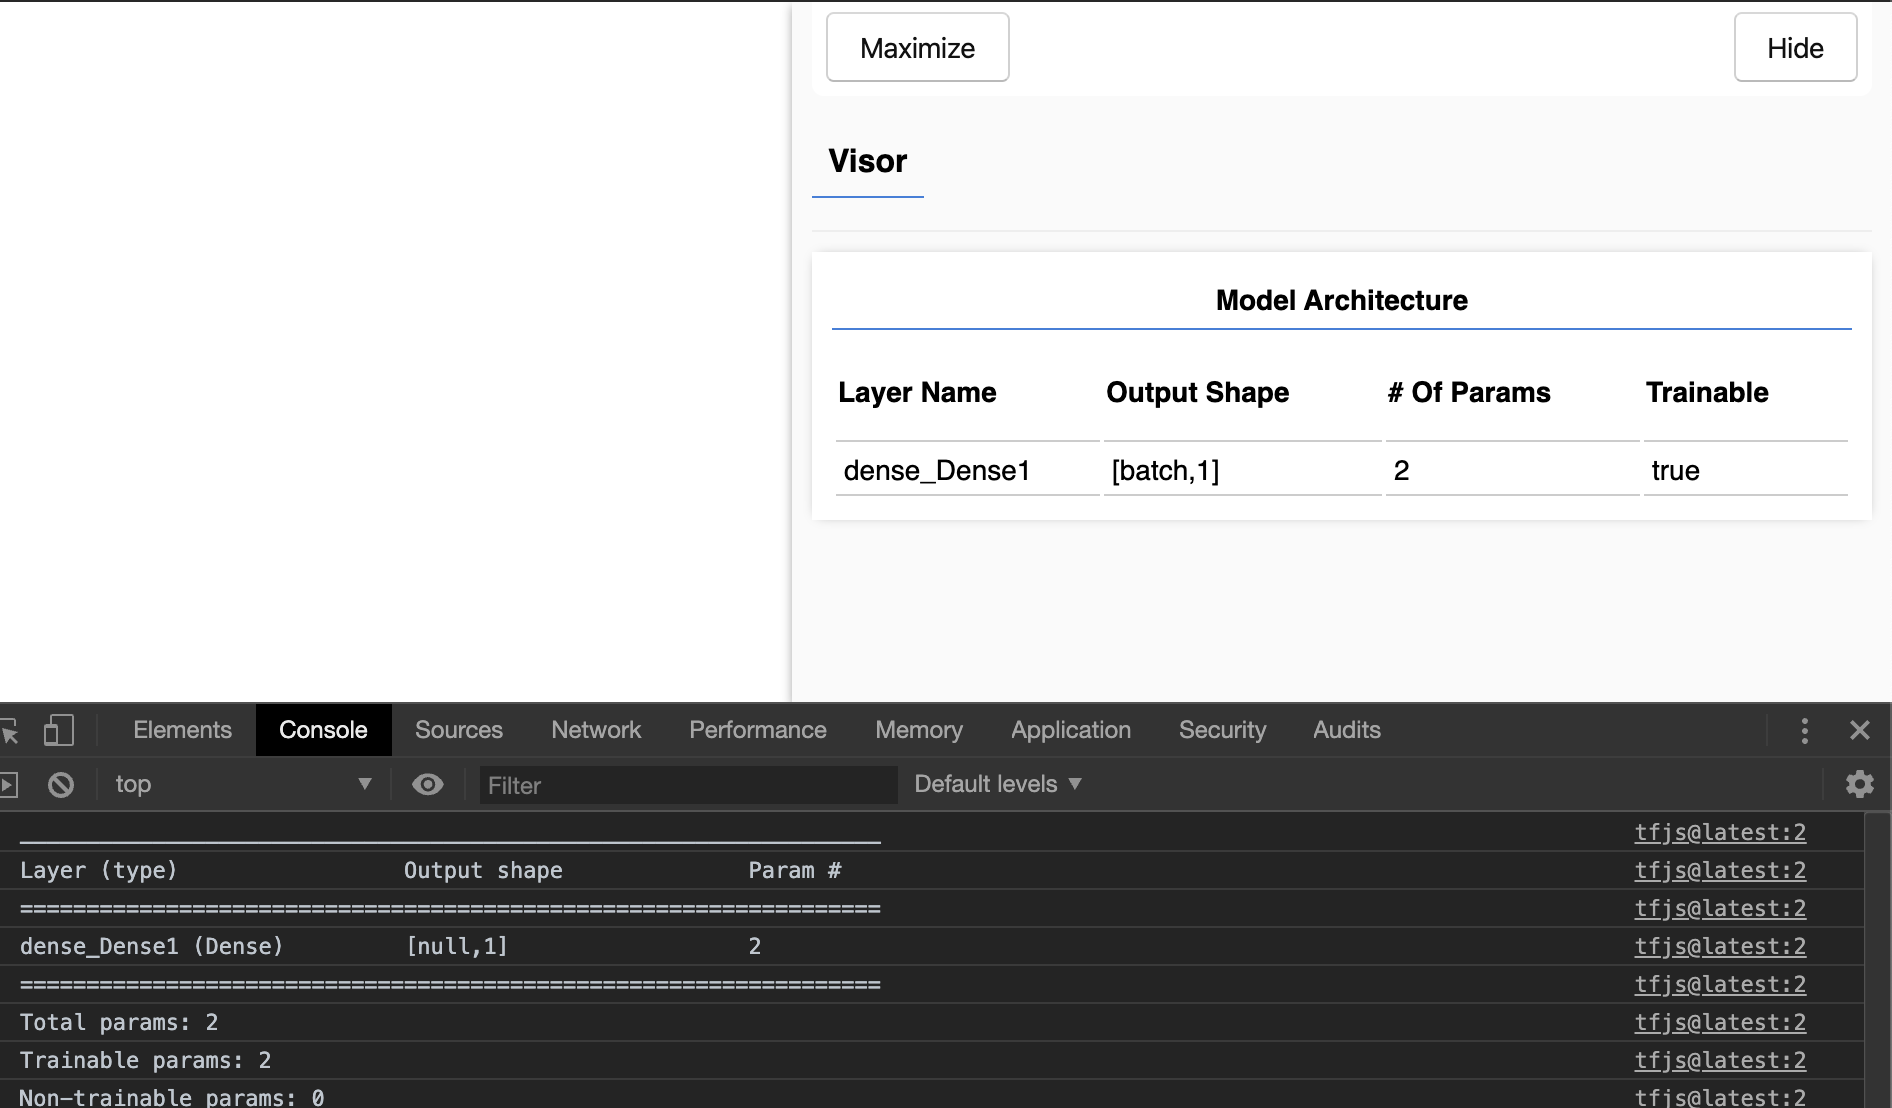
In the above screenshot, I’ve included how the summary looks in both the console and the webpage. As you can see the data is identical.
Great! with one piece done, the next step is to visualize the training progress.
Creating the Training Callback
The next thing you’ll do is add a visualization of the training progress. Currently the progress is written directly to the console. However, in this section you’ll make use of tfjs-vis to display the same information.
Right inside the <script lang="js"> tag, add the following line of code:
const fitCallbacks = tfvis.show.fitCallbacks({ name: 'Model Training' }, ['loss']);
In the above line. you’re invoking the show.fitCallbacks from tfjs-vis which returns a callback object that can be passed into the model during training. You’re also configuring the callback to use the name ‘Model Training’ (feel free to give it any name you like), and you’re configuring it to visualize the ‘loss’ of the model. You can tell tfjs-vis to visualize any metric parameter generated during training, e.g. accuracy, or validation accuracy, validation loss, etc…
If you add a breakpoint in your browser after this line, you will see the object returned by tfjs-vis. You should see something as follows:
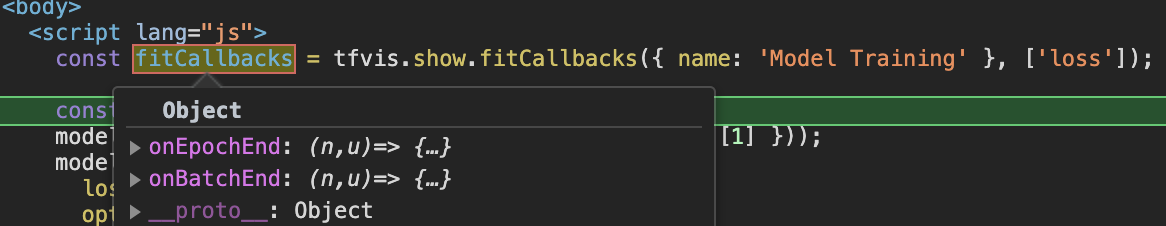
You should see an object that contains both the onEpochEnd and onBatchEnd methods. In the previous tutorial, you created an object that only contained the onEpochEnd.
Installing the Training Progress Callback
To install this callback object, you can edit the callbacks parameter in the fit method, to instead take an array. Wrap the current object with square brackets, and then add the fitCallbacks to the array. Your fit method should look as follows:
model.fit(xs, ys, {
  epochs: 100,
  callbacks:[fitCallbacks, {
    onEpochEnd: async(epoch, logs) =>{
      console.log("Epoch:" + epoch + " Loss:" + logs.loss);
    }
  }]
}).then(() => { /* ... */ }
You can see from the code above that you can continue logging your loss to the console, and you can send the loss value onto tfjs-vis as well.
Refresh your page, and it should looks as follows
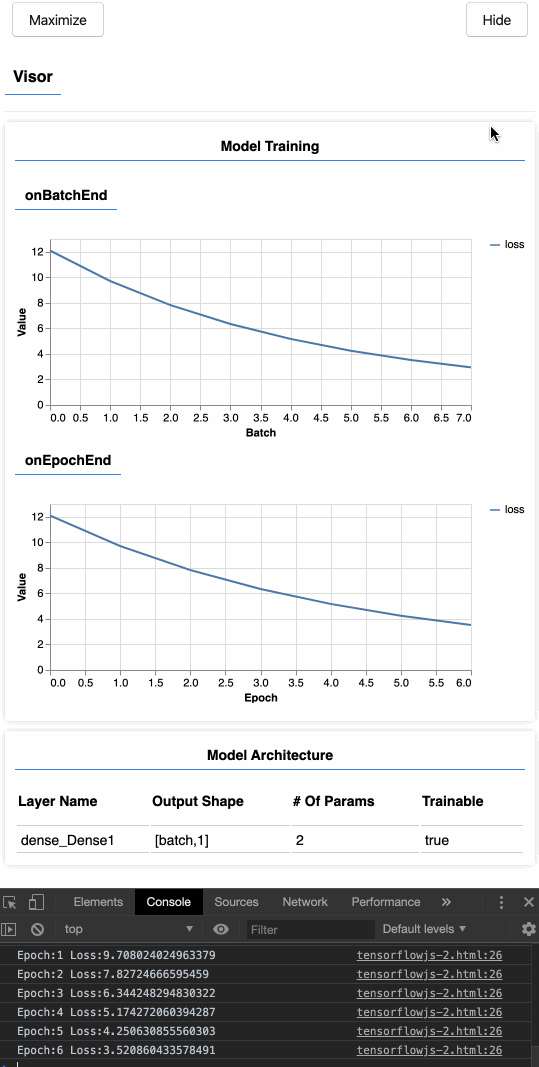
Sweet right? You just added some useful visualizations to help during training. The graph also allows you to hover over specific values of your loss.
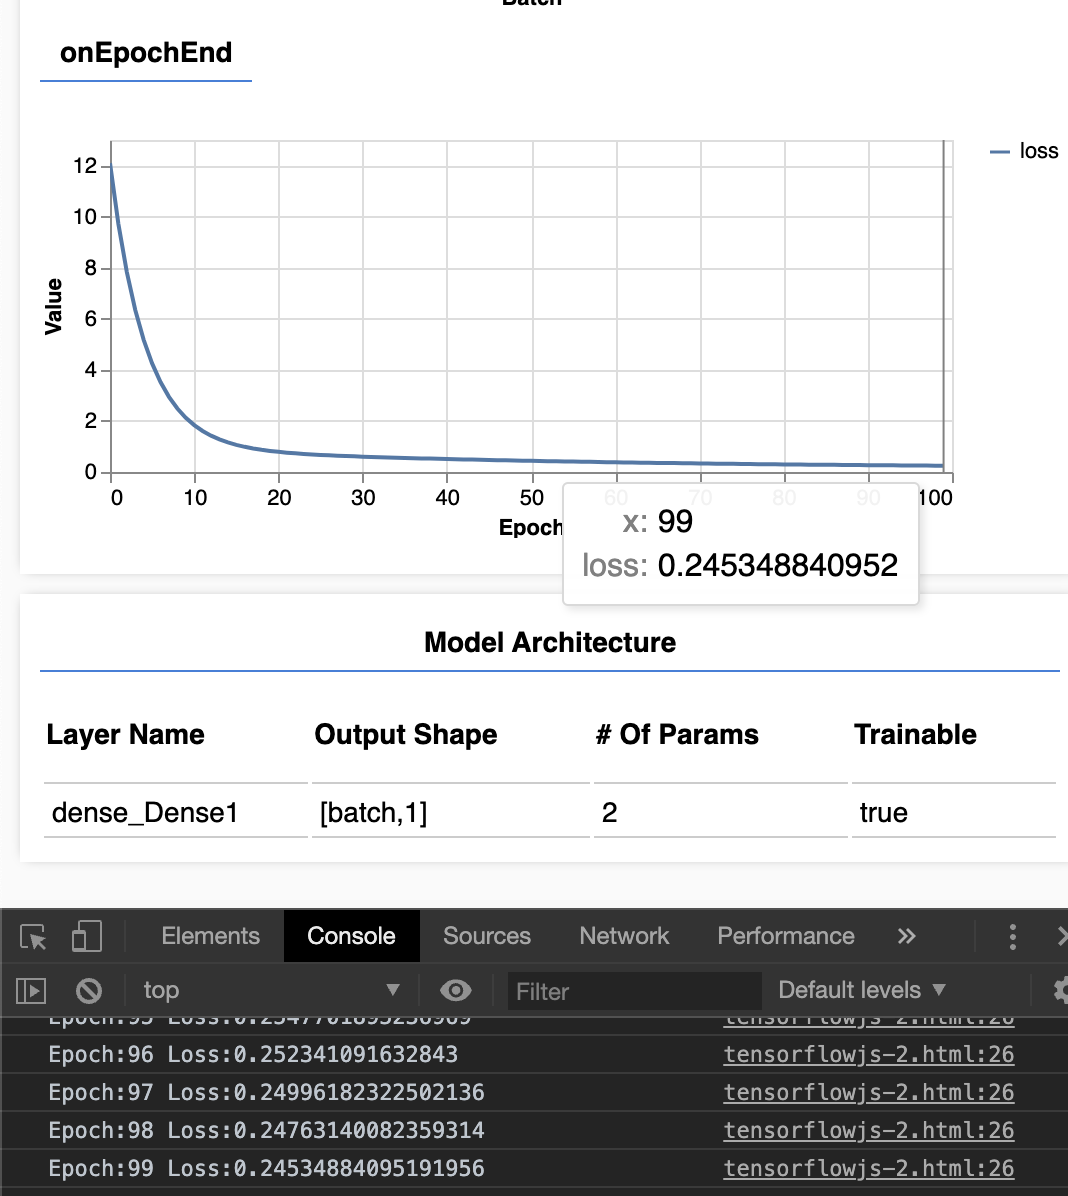
In the above screenshot, you can see that the value of the last iteration had the same loss value as the one printed to the console.
Takeaways I hope you enjoyed this tutorial on how to add the TensorFlow.js visualization library to your project. Hopefully having these visualizations come in handy while you’re training your next model.
If you’re looking for more information on how to edit or modify the visualization, checkout the project repo here.
The best book on machine learning for iOS.

Work with CoreML? Then you need MLFairy.com.

Enjoy my content? Consider becoming a member of my patreon, and help me continue making content!